Peak Fitters#
In order to complete calibration and line identification, it is essential to know the center of the peaks in a spectra. To this end, euv_fitting include automatic peak fitting classes that will extract these centers.
Introduction to Peak Fitting#
Peak fitting has three main steps:
Detection of peaks in the spectra
Determination of region to fit for each peak
Least Squares minimization of gaussian parameters.
Both MultiBatchGaussian and MultiPeakGaussian represent peaks as gaussian distributions, or
Where \(x\) is the channel or wavelength, \(I(x)\) is the intensity at a given x value, \(A\) is the amplitude, \(x_0\) is the center of the gaussian, and \(\sigma\) controls the width. The children of the PeakFitter class convert arrays of x, y data into the best-fit parameters of the gaussians in the data.
As an example on some dummy data:
import numpy as np
import matplotlib.pyplot as plt
from euv_fitting.calibrate.utils import MultiBatchGaussian
def gauss(x, amp, cen, sig):
return amp / (sig * np.sqrt(2 * np.pi)) * np.exp(-(x - cen) ** 2 / (2 * sig ** 2))
x = np.linspace(0, 2047, 2048)
N_GAUSS = 10
AMPLITUDES = 1000 + np.random.random(size = N_GAUSS) * 500
CENTERS = np.linspace(300, 1800, N_GAUSS)
SIGMAS = np.minimum(2 + np.random.normal(0, 0.5, size = N_GAUSS), 1)
y = sum(gauss(x, amp, cen, sig) for amp, cen, sig in zip(AMPLITUDES, CENTERS, SIGMAS)) #Add amplitudes of each gaussian
y += np.random.normal(400, 10, size = 2048) #Add random gaussian noise
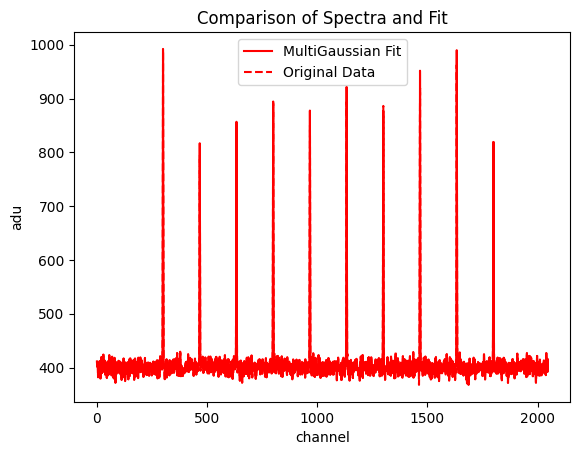
multi = MultiBatchGaussian(y, x, num_peaks = N_GAUSS)
#Note the x argument is optional. If not given, x defaults to np.linspace(0, len(y) - 1, len(y))
multi.fit()
multi.plot_fit(normalize_background = False)
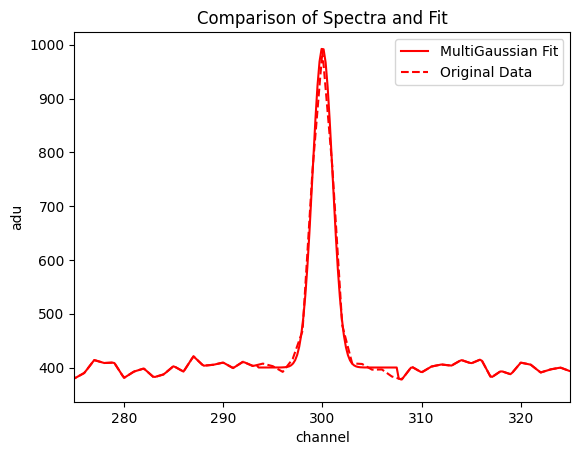
f, ax = plt.subplots() #Generate ax object for multi.plot_fit()
multi.plot_fit(ax = ax, normalize_background = False)
ax.set_xlim([275, 325])
plt.show()
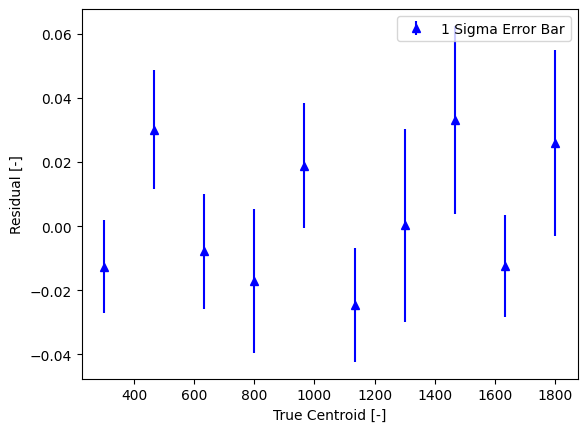
The centroids are stored in the multi.centroids attribute, and information about all of the peak parameters are stored in the multi.gauss_data attribute.
.centroids is an (N x 2) NumPy array, where the first column is the center value and the second is the center uncertainty. By default, .centroids is sorted in decreasing order of intensity. The .get_centroids_ascending() method returns centroids in increasing order of center value.
best_fit_centers, best_fit_uncertainties = multi.get_centroids_ascending().T

#Print column headers
print(f"{'True Center':>14}, {'Fit Center':>14}, {'Fit Center Uncertainty':>20}")

for true_center, best_fit_center, best_fit_uncertainty in zip(
    CENTERS, best_fit_centers, best_fit_uncertainties):


  print(f'{true_center:14.3f}, {best_fit_center: 14.3f}, {best_fit_uncertainty: 20.3f}')
   True Center,     Fit Center, Fit Center Uncertainty
       300.000,        300.013,                0.015
       466.667,        466.637,                0.019
       633.333,        633.341,                0.018
       800.000,        800.017,                0.022
       966.667,        966.648,                0.020
      1133.333,       1133.358,                0.018
      1300.000,       1300.000,                0.030
      1466.667,       1466.634,                0.029
      1633.333,       1633.346,                0.016
      1800.000,       1799.974,                0.029
The centroids can then be used by the calibration classes or analyzed further for line identification.
Read on for more information about the two peak fitting classes, or continue to the next page to learn about the calibration process.
MultiBatchGaussian#
MultiBatchGaussian leverages the fast drop-off of the gaussian function to reduce runtime by fitting isolated gaussians separately. If several gaussians are close enough to affect each other (within ~12 channels) they are grouped into a batch. Each batch of gaussians is then fit with the appropriate number of gaussians, as well as a constant or linear background.
- class MultiBatchGaussian(arr, xs=None, num_peaks=10, y_err=None, resolution=10000, num_poly=1, x_unit='channel', y_unit='adu')#
Fits a sum of peak-like functions to isolated sections of an array.
Since peak-like functions drop off to below noise levels within 2~3 sigma, only peaks that are close together need to be fit together. This class handles grouping up different peaks, fitting them, and storing the parameters of these peaks in the gauss_data and centroids variables.
See also
MultiPeakGaussianFits the whole dataset simultaneously.
- eval(x=None, interp_strat='match_data')#
Helper function to evaluate model at given x values.
If an x value lies within a batch, the y value is results[batch].eval(x = x0). Otherwise, the y value is calculated by linearly interpolating between the edges of the two nearest batches.
- Parameters:
x (array-like, optional) – x values to evaluate model at. Defaults to self.xs.
- Returns:
predicted y values of model.
- Return type:
array-like
- fit(function='gaussian', auto_find_peaks=True, **kwargs)#
Automatically detects and fit peaks to obtain their parameters.
This is the main function of the multibatchgaussian class. It handles peak detection, batch generation, and batch fitting.
- Parameters:
function ({'gaussian', 'voigt'}, optional) – Type of function to fit data with.
auto_find_peaks (boolean, optional) – Whether or not to automatically detect peaks.
**kwargs (dict, optional) – Keyword-arguments to pass to get_peak_indices and other functions.
- Return type:
None
- fit_batch(batch, x, y, weights, function='gaussian')#
Fits a slice of x, y as a sum of peak-like functions.
- Parameters:
batch ((int, int), [list of ints]) – The tuple is (low_index, high_index) of the batch being fit. The list is all peak locations in the data.
x (array-like) – Contains all x values of the data being fit.
y (array-like) – Contains all y values of the data being fit.
weights (array-like) – Contains all weights of the data being fit. Calculated as weights = 1 / self.y_err
function ({'gaussian','voigt'}, optional) – Type of function to fit data with.
- Returns:
result – Result of fit. Contains information about uncertainties, optimal parameter values, background signals.
- Return type:
lmfit.ModelResult
- generate_batches(peak_idxs, width_func=None, **kwargs)#
Generates batches from peak indexes by grouping close peaks.
- Parameters:
peak_idxs (list of ints) – Detected peaks in data, typically the n-highest amplitude.
width_func (callable, optional) – Function must have signature f(x, y) = width, where x and y are array-like slices of the input array, and width is an integer representing the half-width in indexes of the peak.
**kwargs (dict, optional) –
- Returns:
batches – The tuple is (low_index, high_index) of the batch being fit. The list is all peak locations in the data.
- Return type:
list of (int, int), [list of ints]
Examples
>>> dummy_y = np.linspace(0, 10, 100)
>>> MBG = MultiBatchGaussian(dummy_y)
>>> MBG.generate_batches([10, 15, 200])
[((2, 23), [10, 15]), ((92, 108), [100])]
- get_background(x=None, interp_strat='match_data')#
Helper function to evaluate model at given x values.
If an x value lies within a batch, the returned value is results[batch].eval_components(x = x0)[‘Poly’]. Otherwise, the y value is calculated by linearly interpolating between the edges of the two nearest batches.
- Parameters:
x (array-like, optional) – x values to evaluate model at. Defaults to self.xs.
- Returns:
predicted y values of model.
- Return type:
array-like
- place_in_batch(idx)#
Helper function to find index(es) of batch closest to idx.
- Parameters:
idx (int) – Index of point to be tested.
- Returns:
batch index if idx lies within a batch or (left batch index, right batch index) if idx is not within a batch.
- Return type:
int or [int, int]
MultiPeakGaussian#
MultiPeakGaussian fits the entire spectrum simultaneously, and is similar to treating the whole spectra as one large batch. This has the benefit of not needing an initial guess of the gaussian’s \(\sigma\), but does substantially increase the runtime/ instability of the fitting process.
- class MultiPeakGaussian(arr, xs=None, num_peaks=10, y_err=None, resolution=20000, num_poly=4, x_unit='channel', y_unit='adu')#
Fits a sum of peak-like functions (gaussians by default) to an array with options for plotting or disk storage of the resulting fit.
- add_composite(lit_vals: list, rel_intensities=None)#
Adds a composite / multipeak feature to be built later.
- lit_vals: list of floats - literature values for the wavelengths/energies
example: [501.1, 500.3, 502.4]
- rel_intensties: list of lists of two floats or None - describes relative intensities of lines
At least one entry must be None to avoid circular references.
example: [(1, 2), None, (0, 1/2)] This will be interpreted as follows: the 0th peak will have 2 times the amplitude of the 1st peak The 1st peak is allowed to vary freely due to the None the 2nd peak will have 1/2 times the amplitude of the 0th peak.
Equivalently, you could have written: rel_intensities = [(1, 2), None, (1, 1)] rel_intensities = [None, (0, 1/2), (1, 1)]
- build_composites(model, params, function='gaussian')#
Used in fit() to add composite features to the model and params.
model: lmfit.Model - model to add features to. params: lmfit.Parameters - Parameters object to store feature info in function: string - ‘gaussian’ or ‘voigt’ depending on peak type
- build_gaussians(model, params, same_sigma=False, function='gaussian', n_estimate_points=3, **kwargs)#
Used in fit() to add single peaks to the model and params.
model: lmfit.Model - model to add features to. params: lmfit.Parameters - Parameters object to store feature info in same_sigma: boolean - whether or not to force all peaks to share sigma / width function: string - ‘gaussian’ or ‘voigt’ depending on peak type
- fit(return_dict=None, function='gaussian', same_sigma=False, auto_find_peaks=True, **kwargs)#
Primary function of class, finds parameters of peaks to best fit data.
return_dict: dict - used for threading, if given stores results in dict function: string - ‘gaussian’ or ‘voigt’ depending on peak type same_sigma: boolean - whether to force peaks to share sigma / width auto_find_peaks: boolean - if True, self.num_peaks are automatically identified.
- get_centroids_ascending()#
Returns centroids in increasing x value